eOrganic authors:
Helen Atthowe, Biodesign Farm
Alex Stone, Oregon State University
This article is part of the Biodesign Farm Organic System Description
- Figure 1: Soil organic matter (SOM) and cation exchange capacity Old Field
- Figure 2: Soil organic matter (SOM) and cation exchange capacity New Field
- Figure 3: Nitrate-nitrogen, potassium, and phosphorus trends, Old field
- Figure 4: Nitrate-nitrogen, potassium, and phosphorus trends, New field
- Figure 5: Monthly nitrate-nitrogen in minimum-till brassica crop rows compared to no-till brassica crop rows, New field
- Figure 6: Soil pH
- Figure 7: Soil calcium trends, Old field
- Figure 8: Soil calcium trends, New field
- Figure 9: Soil magnesium trends, Old field
- Figure 10: Soil magnesium trends, New field
- Figure 11: Mowed versus unmowed living mulch row middles, New field
- Figure 12: Arbuscular mycorrhizae (AM) density under various tillage and weed management treatments, New field
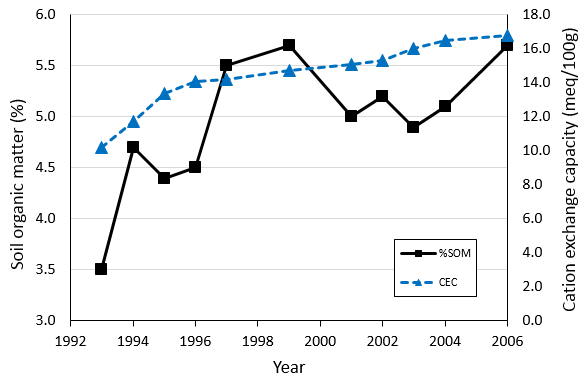
Figure 1. Soil organic matter content (SOM) and cation exchange capacity (CEC): Old field 1993–2006. Soil organic matter (SOM) contents generally increased over time from 3.5 to 5.7% with application of compost and mowed living mulch residues. The rapid increase in SOM content in 1994 likely is due to tilling in a 50-year-old sod pasture and addition of 12 tons/acre of manure compost. Variation in the upward trend in 2001 and 2002 may be related to decreased rates of manure compost application (1999–2002). However, manure compost application was stopped after 2002, and SOM levels generally continued on an upward trend. Cation exchange capacity increased steadily over time from 10.2 to 16.8 meq/100g. All soil tests were taken in May from 0-10 inches with a 3/4-inch-diameter, 10-inch-long soil probe. Ten to 20 samples were taken, mixed in a bucket, and a two cup sample was sent for analysis. This was repeated for a total of 1-3 soil tests per sampling date. Samples were analyzed by A & L Western Agricultural Lab, Modesto, CA.
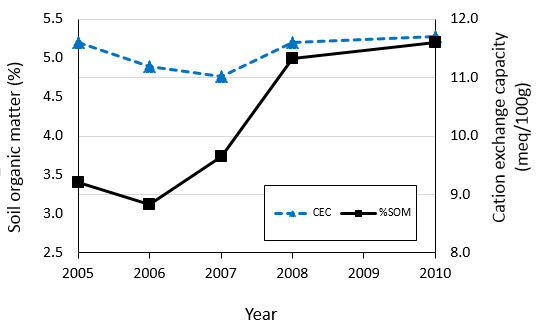
Figure 2. Soil organic matter (SOM) and cation exchange capacity (CEC), New field, 2005–2010. In 2005, SOM content was at 3.4% when New field was in permanent grass pasture; it generally increased over time to 5.2% in 2010. New field was cultivated for vegetable production with application of mowed and incorporated perennial living mulch residues (2006–2010) and low rates of compost (approximately 4 and 2 tons/acre, 2006–2007). Cation exchange capacity did not change over time. All soil tests were taken in May from 0-10 inches with a 3/4-inch-diameter, 10-inch-long soil probe. Ten to 20 samples were taken, mixed in a bucket, and a two cup sample was sent for analysis. This was repeated for a total of 1-6 soil tests per sampling date. Samples were analyzed by A & L Western Agricultural Lab, Modesto, CA.
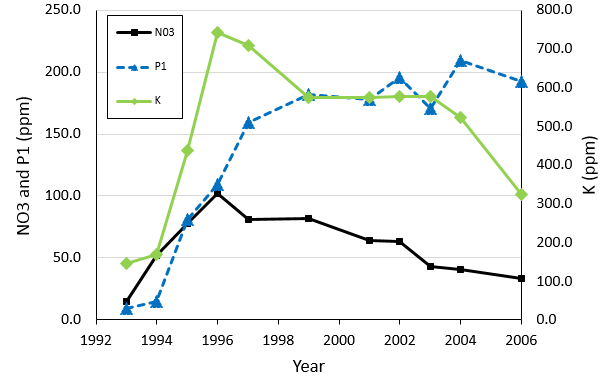
Figure 3. Nitrate-nitrogen, potassium, and phosphorus trends, Old field, 1993–2006. Potassium increased from 145 ppm in 1993 to 713 ppm in 2003, during the time that Biodesign applied manure-based composts annually, and decreased to 323 ppm after Biodesign reduced and then ceased manure compost application. Nitrate-N trends also seem to be related to manure compost application rates; levels increased from lows of 15 ppm in 1993 to highs of 102 ppm in 1996 during and after the highest rates of manure compost application (7–12 tons/acre). Nitrate-N (N03) levels decreased to 33 ppm in 2006, after stopping manure compost application in 2003. Phosphorus levels (Bray P1) increased steadily from lows in 1993 of 9 ppm to highs in 2006 of 192 ppm. All soil tests were taken in May from 0-10 inches with a 3/4-inch-diameter, 10-inch-long soil probe. Ten to 20 samples were taken, mixed in a bucket, and a two cup sample was sent for analysis. This was repeated for a total of 1-3 soil tests per sampling date. Samples were analyzed by A & L Western Agricultural Lab, Modesto, CA.
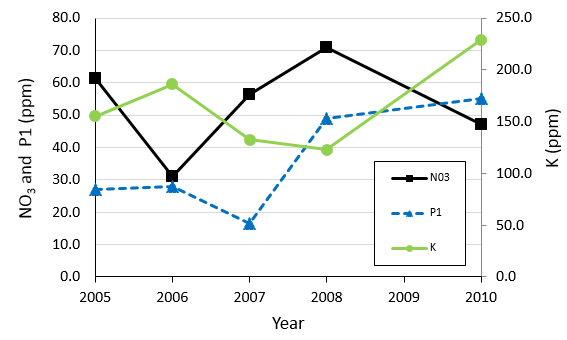
Figure 4. Nitrate-nitrogen, potassium, and phosphorus trends, New field, 2005–2010. Vegetable production began in 2006 in New field. Nitrate-N (N03) increased from lows of 13 ppm in 1993 to highs of 71 ppm in 2008 and 47 in 2010. Potassium (K) increased from 149 ppm in 1993 to 229 ppm in 2010. Phosphorus (Bray P1) levels increased from lows in 1993 of 8 ppm to highs in 2010 of 55 ppm. With lower rates of manure compost application (approximately 2-4 tons/acre), levels of soil K, P, and NO3 never reached the high to excessive levels recorded in Old field, and there were no problems with increasing pH. There was a jump in N03 and P1 in 2005 (compared to 1993 soil tests) due to incorporation of grass/weed/clover pasture (Table 6). All soil tests were taken in May from 0-10 inches with a 3/4-inch-diameter, 10-inch-long soil probe. Ten to 20 samples were taken, mixed in a bucket, and a two cup sample was sent for analysis. This was repeated for a total of 1-6 soil tests per sampling date. Samples were analyzed by A & L Western Agricultural Lab, Modesto, CA.
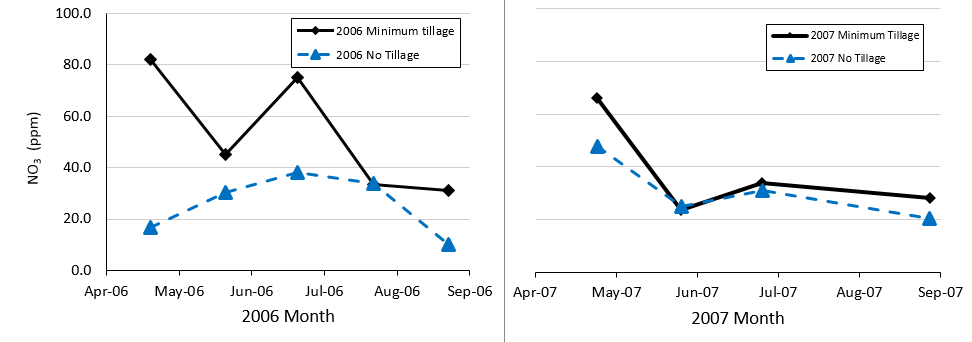
Figure 5. Monthly nitrate-nitrogen in minimum-till brassica crop rows compared to no-till brassica crop rows, New field, 2006 and 2007. Three random samples were taken in each of two 600-ft minimum-till and no-till brassica crop rows every month during the growing season (May–September) in 2006 and 2007. August samples were not taken in 2007. Compost was added to both crop rows in late April at a rate of approximately 4 tons/acre in 2006, and 2 tons per acre in 2007; however, because compost application was concentrated in crop rows only (avoiding row middles), actual compost rates were higher in the crop row. Clover living mulch was also incorporated into minimum-till rows both years in April. Soil nitrate-nitrogen (N) decreased during the growing season in both 2006 and 2007 in both till and no-till rows. In minimum-till rows, N levels were high both years in May (82 and 66 ppm, respectively) 2- 3 weeks after living mulch and compost was incorporated into crop rows; levels dropped to 31.3 ppm (2006) and 28 ppm (2007) by September. In no-till brassica rows, N was generally lower than in minimum-till rows. Nitrogen dropped in September (both years) to 10 ppm (2006) and 20.3 ppm (2007). All soil tests were taken from 0-10 inches with a 3/4-inch-diameter, 10-inch-long soil probe. Ten samples were taken, mixed in a bucket, and a two cup sample was sent for analysis. This was repeated for a total of 3 soil tests per treatment per sampling date. Samples were analyzed by A & L Western Agricultural Lab, Modesto, CA.
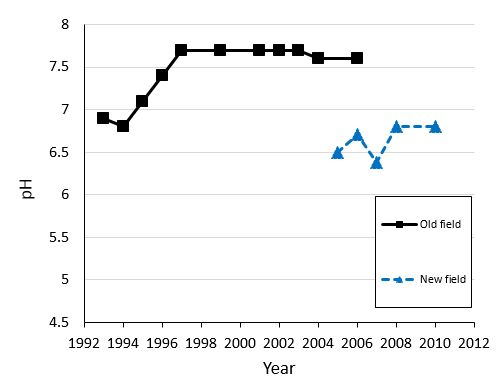
Figure 6. Soil pH, 1993–2010. In Old field, soil pH increased from 6.9 in 1993 to 7.7 in 1999 during the period in which Biodesign was adding large quantities of manure-based compost. During this period, potassium reached excessive levels. Soil pH decreased only slightly to 7.6 (2004–2006) as manure applications and potassium levels decreased. In New field, where lower rates of manure compost were applied and potassium never reached excessive levels, soil pH remained relatively stable at about 6.8. All soil tests were taken in May from 0-10 inches with a 3/4-inch-diameter, 10-inch-long soil probe. Ten to 20 samples were taken, mixed in a bucket, and a two cup sample was sent for analysis. This was repeated for a total of 1-6 soil tests per sampling date. Samples were analyzed by A & L Western Agricultural Lab, Modesto, CA.
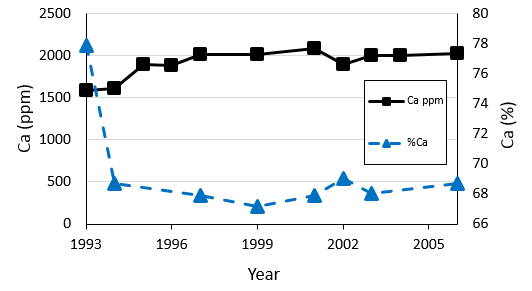
Figure 7. Soil calcium trends, Old field, 1993–2006. Percent calcium levels dropped after initial tillage in 1994 and then remained relatively stable. All soil tests were taken in May from 0-10 inches with a 3/4-inch-diameter, 10-inch-long soil probe. Ten to 20 samples were taken, mixed in a bucket, and a two cup sample was sent for analysis. This was repeated for a total of 1-3 soil tests per sampling date. Samples were analyzed by A & L Western Agricultural Lab, Modesto, CA.
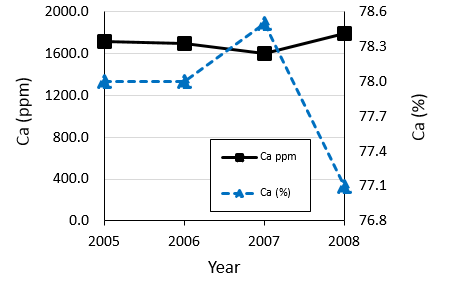
Figure 8. Soil calcium trends, New field, 2005–2008. All soil tests were taken in May from 0-10 inches with a 3/4-inch-diameter, 10-inch-long soil probe. Ten to 20 samples were taken, mixed in a bucket, and a two cup sample was sent for analysis. This was repeated for a total of 1-6 soil tests per sampling date. Samples were analyzed by A & L Western Agricultural Lab, Modesto, CA.
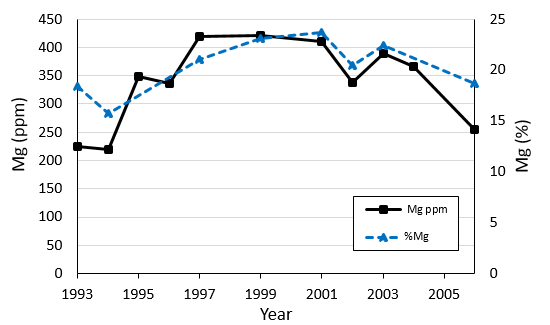
Figure 9.Soil magnesium trends, Old field, 1993–2006. All soil tests were taken in May from 0-10 inches with a 3/4-inch-diameter, 10-inch-long soil probe. Ten to 20 samples were taken, mixed in a bucket, and a two cup sample was sent for analysis. This was repeated for a total of 1-3 soil tests per sampling date. Samples were analyzed by A & L Western Agricultural Lab, Modesto, CA.
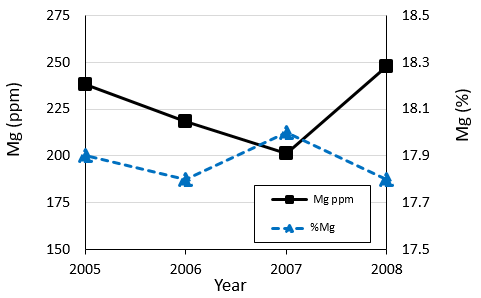
Figure 10. Soil magnesium trends, New field, 2005–2008. All soil tests were taken in May from 0-10 inches with a 3/4-inch-diameter, 10-inch-long soil probe. Ten to 20 samples were taken, mixed in a bucket, and a two cup sample was sent for analysis. This was repeated for a total of 1-6 soil tests per sampling date. Samples were analyzed by A & L Western Agricultural Lab, Modesto, CA.
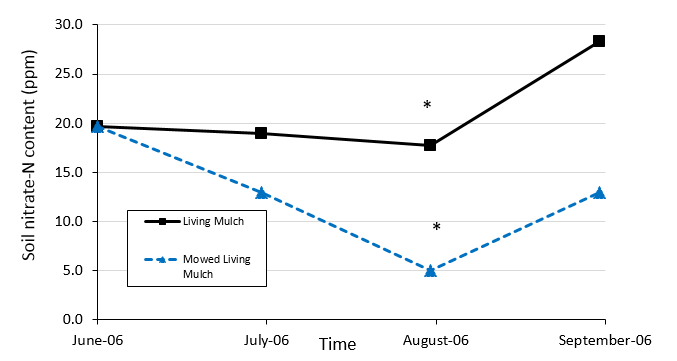
Figure 11. Mowed versus unmowed living mulch row middles, New field, 2006. Three random samples were taken in a 600-ft unmowed living mulch row middle between brussels sprouts and cabbage crop rows in June. After sampling, half of the row was mowed on 18 June 2006. Three random samples each were taken from mowed and unmowed treatments in July, August, and September. Nitrate-nitrogen was numerically lower in mowed plots in July, August and September. Due to the small sample size, only in August was there a statistically significant difference (significant difference indicated by asterisks; p = 0.001). Generally nitrate-nitrogen levels were lower in living mulch row middles than in crop rows because the perennial living mulch was not incorporated into the soil, continued to grow almost year-round, and Biodesign's goal in the New field was to concentrate compost application in crop rows only and avoid row middles. All soil tests were taken from 0-10 inches with a 3/4-inch-diameter, 10-inch-long soil probe. Ten samples were taken, mixed in a bucket, and a two cup sample was sent for analysis. This was repeated for a total of 3 soil tests per treatment and sampling date. Samples were analyzed by A & L Western Agricultural Lab, Modesto, CA.
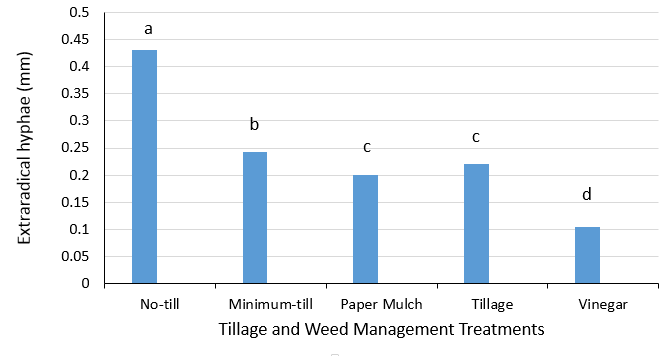
Figure 12. Arbuscular mycorrhizae (AM) density under various tillage and weed management treatments, New field, 2007. Five random samples were taken from three replicates for each of five tillage treatments (no-till, minimum-till, tillage only, tillage + paper mulch, tillage + vinegar) in September during 2007 on-farm experiments. Soil samples were kept cool until analyzed by Dan Mummey, microbiologist at the University of Montana, Missoula. Extraradical hyphae lengths were measured as an indication of AM presence and density. Treatments with different letters are significantly different (p<0.05). The greatest AM density was observed in no-till plots; the second-greatest density occurred in minimum-till plots. The vinegar treatment resulted in the lowest AM density.
This article is part of the Biodesign Farm Organic Systems Description.
Table of Contents:
- System Overview, Map 1, Map 2
- Soil Management System, Soil Tables, Soil Figures
- Insect Pest Management System, Insect Tables, Insect Figures
- Disease Management System, Disease Tables