eOrganic authors:
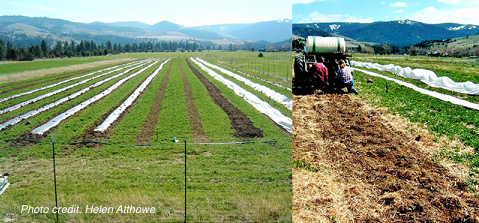
Helen Atthowe, Biodesign Farm
Alex Stone, Oregon State University
This article is part of the Biodesign Farm Organic System Description
- Introduction
- Outcomes
- Key Practices
- Living Mulch and Organic Residues
- Reduced Tillage
- Analysis: Integrating Practice and Research
- References and Citations
- Additional Resources
Introduction
Biodesign's goals were to optimize soil organic matter and plant nutrient contents, reduce tillage, support a diverse soil microbial community, and provide year-round soil cover for natural enemies.
The farm's native soils are classified as capability class VI by the USDA Natural Resources Conservation Service and rated as "poor" for agricultural use (Overview Fig. 2: Farm Fields Map). Over time, Helen's soil-building system transformed these poor soils into fertile soils with high organic matter content. The fundamental components of the soil management system (Table 1) included:
- Reduced tillage
- Perennial and annual living mulches to provide year-round soil cover, with above- and below-ground plant diversity
- Regular addition of mowed clover/weed soil amendments
- Farm-made compost applications
- Alfalfa meal applications when no compost was added
Outcomes
Soil Organic Matter (SOM) and Cation Exchange Capacity (CEC)
Old Field: SOM content increased from 3.5% in 1993 to 5.7% in 2006 (Fig. 1). CEC increased from 10.2 to 16.8 meq/100g during the same period.
In 1993, New field was in permanent grass pasture and SOM was 3.3% (Fig. 2). From 2005 through 2010, New field was cultivated for vegetable production. Low rates of compost (4 and 2 tons/acre, respectively) were applied in 2006 and 2007. Perennial living mulch residues were mowed and incorporated from 2006 through 2010. By 2010, SOM in New field had increased to 5.2%. Cation exchange capacity (CEC) increased from 9.8 to 11.7 meq/100g during the same period (Fig. 2).
Soil Nutrients and pH
Ongoing soil analyses starting in 1993 indicate that all soil macronutrients—potassium (K), phosphorus (P), calcium (Ca), and magnesium (Mg)—increased. While some reached excessive levels during the 1990s, all were generally at target levels from 2004 through 2010 (Table 2). The exceptions were P in Old field, which remained very high (192 ppm), and soil pH in Old field, which exceeded target levels at 7.6.
Nitrate-Nitrogen, Old Field
Soil nitrate-N levels sampled annually in May increased rapidly as a result of high rates of manure compost application (7–12 tons/acre, 1993–1995) (Fig. 3). In 1993, nitrate-N was 15 ppm; by 1996, it was 102 ppm, a level considered excessive. Biodesign reduced compost applications to 2 tons/acre from 1999 through 2002 and stopped using manure compost after 2002. Nitrate-N levels decreased from 41 ppm in 2004 to 33 ppm in 2006.
Nitrate-Nitrogen, New Field
Despite reduced rates of high-N amendments such as compost from 2006 through 2010, soil nitrate-N levels in minimum-till crop rows increased from lows of 13 ppm in 1993 to highs of 47 ppm in 2010 (Fig. 4).
In 2006 and 2007, soil nitrate-N was sampled monthly throughout the growing season. Levels of soil nitrate-N were high to excessive every May after incorporation of clover/weed living mulch and compost (Fig. 5). During the main crop growing season, nitrate-N decreased but remained relatively high (23–75 ppm). In the fall, it decreased to 30 ppm on average.
Potassium (K)
Over the years of annual manure-based compost application, K levels increased in Old field from 145 ppm in 1993 to 713 ppm in 2003. Potassium decreased to 323 ppm after Biodesign stopped manure compost application. In New field, rates of manure compost application were lower (2-4 tons/acre), and soil K never reached the high to excessive levels recorded in Old field.
Phosphorus (P)
Phosphorus levels increased steadily in Old field (from 9 ppm in 1993 to 192 ppm in 2006), even after Biodesign stopped manure compost application. In New field, rates of manure compost application were lower (2-4 tons/acre) and soil P never reached the high levels recorded in Old field.
Soil pH
In Old field, soil pH increased from 6.9 in 1993 to 7.7 in 1999, during the period of time when Biodesign added large amounts of manure-based compost (Fig. 6). Potassium also reached excessive levels over this period. As manure application and K levels decreased, pH decreased only slightly to 7.6 (2004–2006). Despite the high pH, yields and crop quality were very good in Old field (see video Organic No-Till Living Mulch Intro: Weed Em and Reap).
In New field, where lower rates of manure compost were applied and K levels never became excessive, soil pH remained relatively stable (around 6.8). Soil analysis was not performed regularly in New field until the field was tilled/cover-cropped in 2005 to prepare for vegetable production in 2006.
Crop Quality and Yield
Biodesign was known at farmers markets for high-quality peppers and tomatoes, disease and insect damage to crops was low. Over time, crop quality increased. According to Helen, crops seemed to be more resistant to frosts and sunscald (pepper) and to store better, especially red bell peppers and winter squash. Blossom end rot of tomatoes was a minor problem in the mid-1990s, but was not a problem after 1999.
Yields from Old field were excellent in the late 1990s and early 2000s. Total yields decreased slightly once Biodesign moved exclusively to New field and began experimenting with wider permanent clover row middles. While wider living mulch rows decreased the area per acre in commercial crops, this loss was offset by reduced production costs with decreased need for labor and fertilizer/pest management inputs. Biodesign reduced, then eliminated, manure-based compost additions in New field.
Key Practices
Living Mulch and Organic Residues
From 1993 through 2010, Biodesign's system evolved towards less tillage, fewer manure-compost amendments, and more plant-based soil amendments. Biodesign applied several kinds of organic residues throughout the year, both incorporated and surface applied. Organic residues applied were:
- Incorporated living mulch each spring (April)
- Mowed living mulch throughout the growing season
- Incorporated on-farm compost
- Alfalfa meal additions to crop rows in years when no compost was applied
Living Mulch (Annual and Perennial)
Old Field: From 1993 through 2004, Biodesign experimented with annual living mulches. In early spring, clover (usually white clover, Trifolium repens) was planted between 48-inch crop rows or beds. Clover was left undisturbed during the growing season and through the winter. The living mulch was mowed two to four times each growing season to control annual weeds and to cycle residues back into the soil. Before each mowing, the living mulch ranged from 8 to 18 inches tall. Soil cover was greater in the winter because the living mulch grew into crop rows and beds over the growing season and into the fall.
The following spring, clover row middles were tilled and incorporated into the soil; they then became the planting beds for the next growing season. A new clover cover crop was seeded between the new crop rows. This system provided alternating strips with clover cover 11 months of the year and an incorporated “green manure” clover strip each spring. For a video of the Old field system, see Living Mulch Part 1: Weed Em and Reap.
New Field: In 2005, Biodesign moved to a new 6-acre field and began to experiment with less tillage and permanent perennial living mulch row middles. Wider rows permitted mowing with a tractor rather than a hand mower. The 48-inch crop beds were tilled minimally each spring while the permanent living mulch row middles were not tilled. At least 50% of the field was covered with growing clover/weed roots year-round. The living mulch was mowed two to four times annually when the living mulch was 8 to 18 inches tall. Because the perennial clover living mulch grew slowly back into crop rows over the growing season and into the fall, when crop rows were tilled each spring, clover/weed “green manure” was incorporated into the soil every April. In 2006, all crop rows were covered with red clover planted in 2005 which was incorporated in April 2006. From 2007-2010, some new perennial red clover areas in the New field were “strip-tilled” and brought into new vegetable rows. For a video of this system, see Conservation Farming and Sustainability, Missoula, Montana.
Biodesign's living mulch system was designed to:
- Slowly cycle and recycle plant nutrients by regular mowing and surface application of mowed residues. On average, approximately 1 to 1.5 tons/acre of legume hay mulch (dry weight) was added to the soil surface each year in the Old Field and approximately 1-2 tons/acre of legume hay added in the New field (due to greater area in row middle).
- Provide growing roots and winter cover, reduce erosion by wind and water, reduce surface compaction, and reduce the effects of winter freeze/spring thaw cycles and heavy spring rainfall on bare soils.
- Provide N for the following crop. Leguminous living mulches provided significant amounts of N, especially when they were incorporated each spring; when clover living mulch foliage was tested prior to mowing during the growing season, above-ground plant biomass averaged 4% N (Table 3).
- Improve soil physical properties. Growing roots of the living mulch and incorporated or surface-applied residues seemed to improve drainage and tilth over time, allowing Biodesign to get into wet fields earlier in the spring.
- Sequester N in plant biomass to help prevent N leaching. According to a Biodesign living mulch nutrient analysis in 1996, the living mulch contained good levels of nutrients, including N, P, and K in September (Table 3).
Weeds were allowed and sometimes encouraged in the living mulch to build habitat for natural enemies. In the New field, weeds provided diverse annual and perennial species with different rooting types and depth and different plant families (Table 4). In the Old field, Helen tolerated common mallow (Malva neglecta) due to its reported high soil nutrient contribution. See the eOrganic Weed Em & Reap video: Organic No-Till Living Mulch Weed Ecology and the video Winter Annuals as a Living Mulch-Pennycress. Some nutrient cycling likely occurred as weeds were mowed and incorporated.
Despite their proliferation in the living mulch, weeds did not become problematic at Biodesign. Most crops were transplanted onto raised 48-inch beds rather than seeded. Black plastic mulch was used with warm-season crops (tomatoes, peppers, and eggplants). From 1993 through 1996, black plastic was also used with cool-season transplants. Living mulch row middles were mowed regularly in the summer to manage weeds and keep weeds from going to seed. Seeded crops such as lettuce, beets, carrots, parsnips, and beans were hand weeded once or twice per season. The living mulch weed management system reduced and, with some crops, eliminated the need for mechanical cultivation and hand weeding. The following changes in weed ecology were noted:
- Old field: Common mallow (Malva neglecta) became dominant over time. Other more common weeds, such as pigweed (Amaranthus retroflexus) and lamb's quarter (Chenopodium album), were common in the early 1990s, but decreased significantly.
- New field: As a result of the permanent red clover living mulch row middles, there were no weed problems for the first 3 or 4 years. After that time, rhizomatous grasses began moving into permanent clover row middles. By 2010, smooth brome (Bromus inermis) was dominant in row middles and required management (tillage in 2011) because it became too competitive with crops.
Compost
Compost was made on the farm, using oat or wheat straw, clover, and sheep or cattle manure from neighboring farms. Find the compost nutrient content in Table 5 and find composting details by watching the video Organic No-Till Living Mulch Composting: Weed Em and Reap.
Old field: Every spring until 2003, compost was added to the entire field with a Case manure spreader (Disease Table 2). Compost was incorporated along with the clover living mulch. No compost was added from 2003 through 2006. Compost was made on the farm with sheep and/or cattle manure, straw, and mowed clover residue. In the 1990s, Helen used Luebke's Controlled Microbial Composting (CMC) techniques for compost production and quality evaluation.
New field: In 2006 and 2007, compost was added mainly to the 48-inch crop beds with a Case manure spreader. Avoiding compost application to living mulch row middles likely increased the rate of compost application in crop rows. Though compost was applied at 4 tons/acre (2006) and 2 tons/acre (2007) rate, in-crop-row compost application rates may have been higher in some areas. It was difficult to precisely apply low rates of compost to crop rows only with the available equipment. In the spring of 2006, clover living mulch was incorporated along with compost in crop rows only. In 2007 through 2010, the perennial clover grew back into crop rows and beds during the growing season, fall, and early spring and was incorporated into the soil every April (Disease Table 3). New rows were brought into cultivation 2007-2010 from untilled red clover areas in New field. From 2008-2010 clover was incorporated, but no compost was added to crop rows.
Supplemental Amendments
From 2008 through 2010, alfalfa meal was spread in crop rows (New field) and incorporated in the spring before planting along with some clover/weed living mulch that grew into crop rows (Disease Table 3). Rates were approximately 50 lb/4-ft x 600-ft row. Alfalfa meal was spread by hand, using a pickup truck driving on living mulch row middles and straddling crop beds. According to Parnes (1990), alfalfa meal has a reported nutrient content of 2.7% (N), 0.5% (P), and 2.8% (K).
Gypsum was hand applied to New field crop rows in 2007, at 100 lb/4-ft x 600-ft row.
Reduced Tillage
Tillage is an important part of many organic farming systems that utilize organic residues for soil fertility management. In annual horticultural systems, tillage is also utilized for weed management. However, primary tillage was greatly reduced at Biodesign, and tillage for weed management was eliminated.
Old field: From 1994 through 1999, tillage was done with a 6-ft rototiller. In 1999, the rototiller was sold. A potato cultivator was modified for primary tillage; after primary tillage, crop beds were tilled with a 3-ft rototiller.
New field: Strip tillage was done in 4-ft beds. Four-foot-wide permanent living mulch row middles were left untilled. Primary tillage equipment included a single shank chisel plow/ripper followed by a 3-ft rototiller.
Biodesign evolved toward less and less tillage over time, based on observations that competition from the living mulch did not seem to reduce yields economically and soil and crop quality seemed to improve. Further impetus was results of on-farm research (2005), which showed a slight reduction in SOM two weeks after the 60-year-old pasture was tilled in (Table 6).
Analysis: Integrating Practice and Research
The goal of an organic soil management system is to build SOM and enhance soil microbial activity, rather than to rely on quick-release fertilizers to directly feed crops. Decomposition, mineralization of plant-available nutrients, and nutrient retention are the foundations of soil ecosystem functions on organic farms. As organic matter decomposes, nutrients such as N, P, and K are mineralized and made available to plants.
Soil microbes play a role in all of these processes (Kramer, 2006). In turn, soil microbial biomass and activity are regulated by the quantity and quality of SOM, carbon (C), and N inputs (Fierer et al., 2009; Kallenbach and Grandy, 2011). Research has shown that total C content (Drinkwater, 1998; Kong, 2005) and/or lability (ease of decomposition) of organic matter (Marriott and Wander, 2006; Smukler et al., 2008; Kallenbach and Grandy, 2011) determine how organic amendments will affect microbial biomass by affecting the rate of decomposition and N mineralization. Materials with higher C content tend to decompose more slowly, thus releasing N slowly over the season.
Organic amendments such as manure, grass and/or legume cover crops, mulches, and compost vary in C content and C:N ratio. Therefore, they vary in their rate of decomposition and in how they stimulate microbial biomass.
When Biodesign began in 1993, Helen’s main concern in Montana's cold-spring climate was how to get enough N and P into crops for good yields and early maturity at farmers markets. Over time, her primary challenge became how to manage too much N, P, and K in the system and how to move towards higher C soil amendments. Through on-farm research, Biodesign investigated how to manage organic residues in a way that would provide enough nutrients for good and early yields, while linking N and P mineralization to SOM decomposition to avoid excessive levels. Biodesign's nutrient cycling system worked in a synergistic manner with its biological insect management system.
Nitrogen Cycling System
Biodesign’s system evolved in three phases:
- In 1994 and 1995, Helen assumed she would need to supply a considerable amount of nutrients, based on soil class information and on 1993 soil tests. Helen added N based on her nutrient replacement calculations.
- In the late-1990s, with more experience using reduced tillage and living mulches, as well as annual May soil test records, Helen felt that fertility, particularly N and K, was present in adequate, even excess supply, so she decreased manure compost application rates with the goal of decreasing N, P, and K soil levels.
- By 2005, with information from 11 years of soil tests and yield records, Helen moved towards a system with greater tillage reduction, increased space between crop rows, lower application rates of manure compost, and greater reliance on higher C plant residue soil amendments.
Each year, soils were tested in May after April incorporation of living mulch and sometimes compost. Helen used these soil analyses and a nutrient replacement calculation to calculate how much N she needed to apply. She assumed that annual vegetable crops generally remove approximately 150 lb N/acre. As Biodesign's system evolved, sources of N were:
- Organic residues—incorporated and mowed living mulch (Table 3), compost (Table 5), and alfalfa meal
- Residual soil nitrate-N (nitrate pool) (Fig. 3 and Fig. 4).
- Mineralization of N from SOM (assumed to be approximately 30 to 60 lb N/acre over a 60-day period in the summer)
- Irrigation water (Table 7)
Over time Biodesign observed the following outcomes:
- Soil contained high levels of N, P, K, Ca, and Mg (Table 2).
- N and other nutrients were released relatively quickly in the spring after incorporation of organic residues, then appeared to be released more gradually over the growing season, possibly from the reservoir of SOM.
- No post-plant, side-dress fertilizer was needed or applied.
- The microbial community was relatively high in no-till living mulch row middles, even when crop row tillage decreased microbial populations, particularly arbuscular mycorrhizae.
Key to Biodesign’s nitrogen cycling system was reduced tillage and regular addition of organic plant residues (mowed legume living mulch) with differing C:N ratios during the growing season, rather than simply relying on compost/green manure incorporation into the soil once every spring. Biodesign’s goal was to match N mineralization with crop demand and achieve a more idealized “steady-state condition”, in which organic N concentrations remain relatively constant in the soil. Even though this approach is likely to be superior to “discrete manure spreading events”, nutrient levels are hard to predict because N mineralization rates can vary considerably with moisture and temperature (Crohn, 2004) and plant maturity which is often expressed in terms of C:N ratios and lignin content (Fox et al., 1990). The C:N ratio of Biodesign’s mowed living mulch residue when tested in 1996 was highest in July and lower in August and September (Table 3).
Soil nitrate-N: Nitrogen mineralization appeared to be relatively rapid at Biodesign; levels of nitrate-N in Biodesign soils were high to excessive every May when soils were tested within 2-3 weeks after incorporation of living mulch and compost or living mulch/alfalfa meal in April (Figure 3 and Figure 4). During on-farm research studies in 2006 and 2007 Helen sampled soil N levels monthly throughout the growing season in an effort to understand what was the contribution of incorporated residues and mowed living mulch residues to soil nutrient availability. Nitrogen in her “standard-practice” minimum-till crop rows decreased but remained relatively high (24-75 ppm) during the main crop growing season (June–August); N levels decreased in September to 31 ppm (2006) and 28 ppm (2007) (Figure 5). However, in no-till crop rows, where organic residues were not incorporated into the soil and clover living mulches grew back into crop rows over the season, N levels were lower (16-47 ppm) during the cropping season and dropped in September to 10 ppm (2006) and 20 ppm (2007) (Figure 5).
Untilled living mulches reportedly absorb a large percentage of residual soil N (65–70%) and sequester it in plant biomass during the winter and in the spring when leaching rains may occur (Smith, 2007). Another observation from Biodesign’s soil test records may further support the N recycling/sequestering potential of no-till living mulches between crop rows; soil nitrate-N levels were lower in no-till living mulch rows than in crop rows and also decreased temporarily after perennial living mulch row middles were mowed in the summer. According to results from an on-farm study in 2006, August nitrate-N levels were lower in mowed verses un-mowed sections of a 600-ft no-till living mulch row middle (Figure 11). This could be due to temporary immobilization of N as a result of microbial activity during decomposition of mowed residues. Microbial activity appeared to be high in untilled living mulches when tested at Biodesign. Denitrification from surface-applied living mulch may also have occurred.
Soil microbial activity: Total microbial biomass (TMB) was measured in early June during 1996 on-farm research. TMB levels were relatively high in untilled living mulch plots (528 ppm) and much lower in tilled plots (345 ppm). Microbial activity and N retention may have remained high due to reduced tillage and annual application of organic residues (Calderón et al., 2000; Minoshima et al., 2007; Jackson et al., 2012). In 2007 on-farm research at Biodesign, arbuscular mycorrhizae were lower in tilled plots than in no-till plots (Figure 12).
Biodesign’s good and early crop yields from 1994-2010 indicate that sufficient N levels were available for crop growth. In California, on-farm research suggests that a soil nitrate-N level of 20 ppm or greater is sufficient to maintain maximum vegetable crop growth rates for several weeks or more in typical field conditions (Smith, 2007). Smith (2007) also suggests that spring vegetable crops usually have higher N fertilizer requirements because soil N is lower due to leaching of residual soil nitrate in the winter and low soil microbe activity in cooler spring soils.
Nitrate leaching at Biodesign appeared to be relatively low according to well water analysis in 2000 and 2010, which recorded safe levels of nitrate-nitrogen.
Phosphorus
In Old field, P increased steadily from a low of 9 ppm in 1993 to a high of 192 ppm in 2006 ppm, even after Biodesign reduced and stopped manure compost application. However, with lower rates of manure compost application, levels of soil P in New field never reached the high to excessive levels recorded in the Old field.
Potassium
In Old field, K increased sporadically from 145 ppm in 1993 to 713 ppm in 2003 during the time that Biodesign applied manure-based composts annually, and decreased to 323 ppm when Biodesign reduced and stopped manure compost application. However, with lower rates of manure compost application, levels of soil K in New field never reached the high to excessive levels recorded in the Old field.
Soil pH
In Old field, the pH increased from 6.9 in 1993 to 7.7 in 1999, during the time that Biodesign was adding larger amounts of manure-based compost and potassium reached excessive levels in the soil; the pH decreased only slightly to 7.6 (2004–2006) as manure applications and potassium levels decreased. Despite the high pH, yields and crop quality were very good in Old field. In New field, where lower applications of manure compost were applied and potassium levels never reached excessive levels, soil pH remained relatively stable around 6.8. Soil tests were not taken regularly in New field from 1996–2004 until the field was tilled to prepare it for vegetable production in 2005.

This article was developed with support from USDA's National Institute of Food and Agriculture through the Western Sustainable Agriculture Research and Education program under grant number SW13-017.
References and Citations
- Calderón, F. J., L. E. Jackson, K. M. Scow, and D. E. Rolston. 2000. Microbial responses to simulated tillage in cultivated and uncultivated soils. Soil Biology and Biochemistry 32: 1547–1559. (Available online at: http://www.ucanr.org/sites/ct/files/44358.pdf) (verified 22 Dec 2015)
- Drinkwater, L. E., and P. Wagoner. 1998. Legume-based cropping systems have reduced carbon and nitrogen losses. Nature 396: 262–265. (Available online at: http://www.nature.com/nature/journal/v396/n6708/abs/396262a0.html) (verified 22 Dec 2015)
- Fierer, N., M. S. Strickland, D. Liptzin, M. A. Bradford, and C. C. Cleveland. 2009. Global patterns in belowground communities. Ecology Letters 12: 1238–1249. (Available online at: http://onlinelibrary.wiley.com/doi/10.1111/j.1461-0248.2009.01360.x/abstract) (verified 22 Dec 2015)
- Jackson, L. E., T. M. Bowles, A. K. Hodson, and C. Lazcano. 2012. Soil microbial-root and microbial-rhizosphere processes to increase nitrogen availability and retention in agroecosystems. Current Opinions in Environmental Sustainability 4: 517–522. (Available online at: http://www.sciencedirect.com/science/article/pii/S1877343512000991) (verified 22 Dec 2015)
- Kallenbach, C., and A. S. Grandy. 2011. Controls over soil microbial biomass responses to carbon amendments in agricultural systems: A meta-analysis. Agriculture, Ecosystems and Environment 144: 241–252. (Available online at: http://pubpages.unh.edu/~asf44/files/kallenbach_and_grandy_2011.pdf) (verified 22 Dec 2015)
- Kong, A.Y.Y., J. Six, D. C. Bryant, R. F. Denison, and C. van Kessel. 2005. The relationship between carbon input, aggregation, and soil organic carbon stabilization in sustainable cropping systems. Soil Science Society of America Journal 69: 1078–1085. (Available online at: http://www.plantsciences.ucdavis.edu/vankessel/publications/bryant_et_al.pdf) (verified 22 Dec 2015)
- Kramer, S. B., J. P. Reganold, J. D. Glover, B.J.M. Bohannan, and H. A. Mooney. 2006. Reduced nitrate leaching and enhanced denitrifier activity and efficiency in organically fertilized soils. Proceedings of the National Academy of Sciences of the United States of America 103: 4522–4527. (Available online at: http://www.pnas.org/content/103/12/4522.full) (verified 22 Dec 2015)
- Marriott, E. E., and M. Wander. 2006. Qualitative and quantitative differences in particulate organic matter fractions in organic and conventional farming systems. Soil Biology and Biochemistry 38: 1527–1536. (Available online at: http://www.sciencedirect.com/science/article/pii/S0038071706000022) (verified 22 Dec 2015)
- Minoshima, H., L. E. Jackson, T. R. Cavagnaro, S. Sánchez-Moreno, H. Ferris, S. R. Temple, S. Goyal, and J. P. Mitchell. 2007. Soil food webs and carbon dynamics in response to conservation tillage in California. Soil Science Society of America Journal 71: 952. (Available online at: https://dl.sciencesocieties.org/publications/sssaj/abstracts/71/3/952) (verified 22 Dec 2015)
- Parnes, R. 1990. Fertile soil: A grower's guide to organic and inorganic fertilizers. agAccess, Davis, CA
- Smith, R. 2007. Farm water quality planning project. PowerPoint presentation. University of California Cooperative Extension/USDA Natural Resources Conservation Service. (Available online at: http://cemonterey.ucanr.edu/files/85240.pdf) (verified 28 Dec 2015)
- Smukler, S. M., L. E. Jackson, L. Murphree, R. Yokota, S. T. Koike, and R. F. Smith. 2008. Transition to large-scale organic vegetable production in the Salinas Valley, California. Agriculture, Ecosystems and Environment 126: 168–188. (Available at: https://ucanr.edu/repositoryfiles/Agriculture,%20Ecosystems%20and%20Environment-93570.pdf) (verified 22 Dec 2015)
Additional Resources
- Atthowe, H. 2010. Living mulch system: Introduction [Video clip]. In A. Stone (Producer) Weed 'em and reap. Part 2: Reduced tillage systems for vegetable cropping systems [DVD]. Oregon State University Dept. of Horticulture. Corvallis, Oregon. (Available online at: http://articles.extension.org/pages/18414/video-clip:-weed-em-and-reap-part-2-living-mulch-system:-introduction) (verified 8 Sep 2016)
- Atthowe, H. 2009. Living mulch system: Weed ecology [Video clip]. In A. Stone (Producer) Weed 'em and reap. Part 2: Reduced tillage systems for vegetable cropping systems [DVD]. Oregon State University Dept. of Horticulture. Corvallis, Oregon. (Available online at: http://articles.extension.org/pages/18409/video-clip:-weed-em-and-reap-part-2-living-mulch-system:-weed-ecology) (verified 8 Sep 2016)
- Atthowe, H. 2009. Living mulch system: Composting [Video clip]. In A. Stone (Producer) Weed 'em and reap. Part 2: Reduced tillage systems for vegetable cropping systems [DVD]. Oregon State University Dept. of Horticulture. Corvallis, Oregon. (Available online at: http://articles.extension.org/pages/18413/video-clip:-weed-em-and-reap-part-2-living-mulch-system:-composting) (verified 12 Sep 2016)
- Diver, S. 2004. Controlled microbial composting and humus management: Luebke compost [Online]. Fayetteville, AR. Available at: http://www.ibiblio.org/steved/Luebke/Luebke-compost2.html (verified 8 Sep 2016)
- eOrganic Community of Practice. 2008. Living mulch part 1 [Video clip]. eOrganic YouTube Channel. (Available online at: https://youtu.be/uJk4R1xpMC8) (verified 8 Sep 2016)
- Wheaton, P. 2011. Conservation farming and sustainability, Missoula, Montana [Video clip]. YouTube. (Available online at: https://www.youtube.com/watch?v=XYfZf5Nllsk&feature=youtu.be) (verified 12 Sep 2016)
- Wheaton, P. 2011. Winter annuals as a living mulch—pennycress [Video clip]. YouTube. (Available online at: https://www.youtube.com/watch?v=1_fBY5UG-Q4&feature=youtu.be) (verified 12 Sep 2016)
This article is part of the Biodesign Farm Organic Systems Description.
Table of Contents:
- System Overview, Map 1, Map 2
- Soil Management System, Soil Tables, Soil Figures
- Insect Pest Management System, Insect Tables, Insect Figures
- Disease Management System, Disease Tables