This article is part of the Woodleaf Farm Organic Systems Description.
- Figure 1: Soil Organic Matter 1982-2014
- Figure 2: Soil Cation Exchange Capacity 1982-2014
- Figure 3: Nitrate nitrogen 1982-2014
- Figure 4: Total Kjeldahl nitrogen 2014
- Figure 5: Soil zinc 1982-2014
- Figure 6: Soil copper 1982-2014
- Figure 7: Soil boron 1982-2014
- Figure 8: Soil sulfur 1982-2014
- Figure 9: Soil manganese 1982-2014
- Figure 10: Peach leaf analysis 1994 and 2014
- Figure 11: Peach fruit analysis for macronutrients 2014
- Figure 12: Peach fruit analysis for micronutrients 2014
- Figure 13: Soil calcium 1982-2014
- Figure 14: Soil cation balance: calcium 1982-2014
- Figure 15: Soil cation balance: magnesium 1982-2014
- Figure 16: Soil potassium 1982-2014
- Figure 17: Soil phosphorus 1982-2014
- Figure 18: Soil magnesium 1982-2014
- Figure 19: Soil cation balance: potassium 1982-2014
- Figure 20: Soil pH 1982-2014
- Figure 21: Soil iron 1982-2014
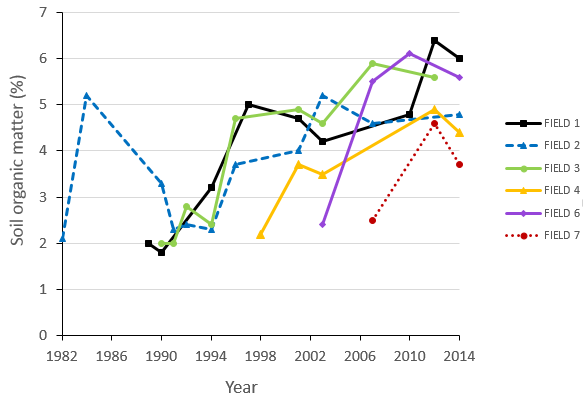
Figure 1. Soil organic matter (SOM) trends, 1982–2014. Samples were taken from six fields. For each field, at least 10 soil samples (0-12 inch depth) were taken with a 1” soil probe and mixed thoroughly; a sub-sample was sent to A&L Western Laboratories, Modesto, California for analysis. SOM content ranged from 2 to 3% in the 1980s and 1990s, increasing to 4 to 6% from 2000 through 2014. Composted manure was applied through 1991. Since 1992, Woodleaf has applied a range of higher carbon organic materials throughout the year—composted yard waste, mowed grass/clover/weed living mulch residues, and chipped branch wood from pruned crops (twice each year).
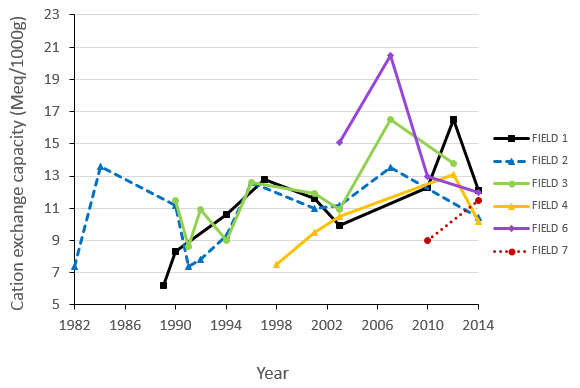
Figure 2. Soil cation exchange capacity (CEC) trends, 1982–2014. Samples were taken from six fields. For each field, at least 10 soil samples (0-12 inch depth) were taken with a 1” soil probe and mixed thoroughly; a sub-sample was sent to A&L Western Laboratories, Modesto, California for analysis. As soil organic matter content increased, average CEC increased from 9.5 to 11.7 meq/100g.
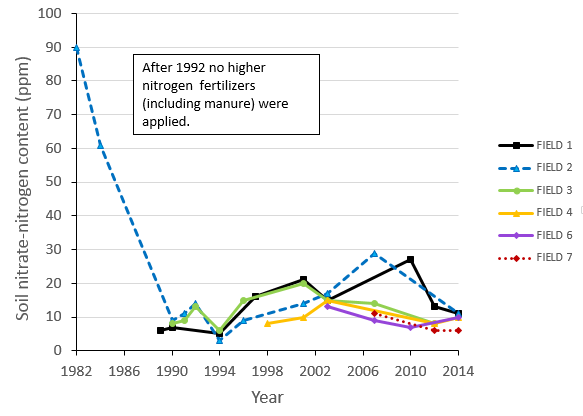
Figure 3. Nitrate-nitrogen trends, 1982–2014. Samples were taken from six fields. For each field, at least 10 soil samples (0-12 inch depth) were taken with a 1” soil probe and mixed thoroughly; a sub-sample was sent to A&L Western Laboratories, Modesto, California for analysis. Soil nitrate-N content levels dropped markedly between 1982 and 1990, before increasing in the 1990s and early 2000s. From an average high of 20 ppm in the mid-2000s, nitrate-N fell to an average of 9 ppm in 2014. High levels recorded in the early years may be due to composted manure application, which was discontinued in 1992. Since then, Woodleaf has applied a range of lower N organic materials throughout the year—composted yard waste, mowed grass/clover/weed living mulch residues, and chipped branch wood from pruned crops (twice each year).
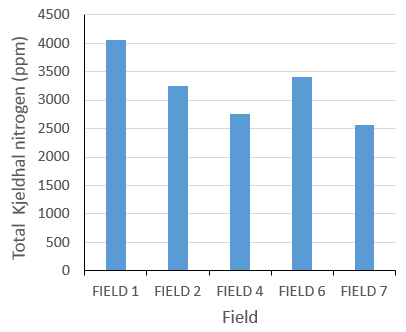
Figure 4. Total Kjeldahl nitrogen content (TKN), 2014. Samples were taken from fields 1, 2, 4, 6, and 7. For each field, at least 10 soil samples (0-12 inch depth) were taken with a 1” soil probe and mixed thoroughly; a sub-sample was sent to A&L Western Laboratories, Modesto, California for analysis. TKN is the sum of organic N, ammonia (NH3), and ammonium (NH4+).
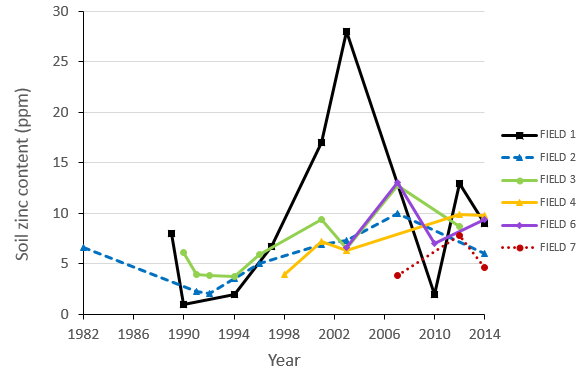
Figure 5. Soil zinc trends, 1982–2014. Samples were taken from six fields. For each field, at least 10 soil samples (0-12 inch depth) were taken with a 1” soil probe and mixed thoroughly; a sub-sample was sent to A&L Western Laboratories, Modesto, California for analysis. Soil Zn content has increased from an average of 5.8 ppm in the 1980s and early 1990s to an average of 7.9 ppm in 2014; levels are now in the high sufficient range. Zinc has not been applied at Woodleaf since 2009.
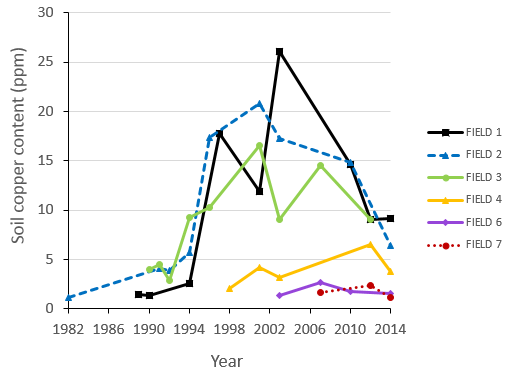
Figure 6. Soil copper trends, 1982–2014. Samples were taken from six fields. For each field, at least 10 soil samples (0-12 inch depth) were taken with a 1” soil probe and mixed thoroughly; a sub-sample was sent to A&L Western Laboratories, Modesto, California for analysis. Soil Cu content increased rapidly to excessive levels in the late 1990s. Since then they have stabilized at an average of 5.2 ppm, which is in the high sufficient range. Carl Rosato sprayed Cu for disease management in the late 1980s and early 1990s, but stopped due to buildup of excessive Cu in the soil.
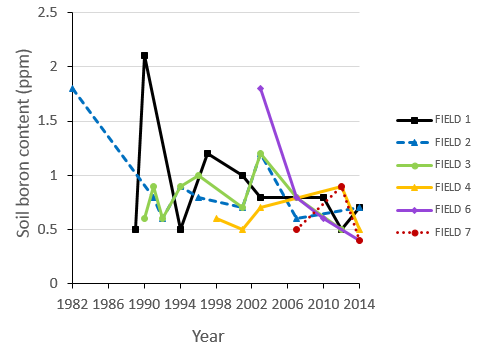
Figure 7. Soil boron trends, 1982–2014. Samples were taken from six fields. For each field, at least 10 soil samples (0-12 inch depth) were taken with a 1” soil probe and mixed thoroughly; a sub-sample was sent to A&L Western Laboratories, Modesto, California for analysis. Soil B content has decreased to an average of 0.4 ppm, which is in the low range. Boron is applied annually at 10 lb/acre and is included in Carl Rosato's foliar mineral mix application at bloom (Solubor). In 2013 and 2014, some apple varieties showed symptoms of B deficiency (mild external cork on fruit surfaces at harvest). Symptoms were seen on less than 1% of fruit.
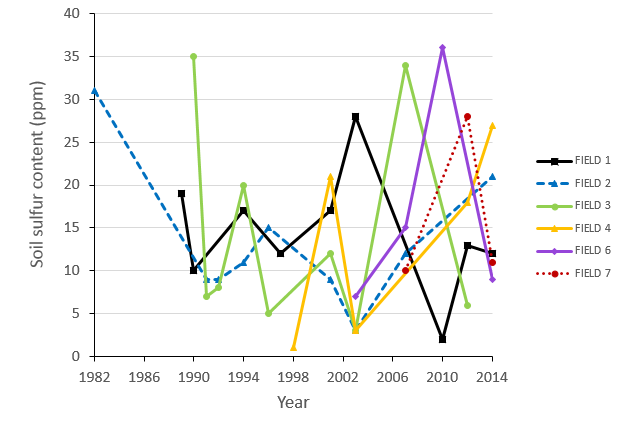
Figure 8. Soil sulfur trends, 1982–2014. Samples were taken from six fields. For each field, at least 10 soil samples (0-12 inch depth) were taken with a 1” soil probe and mixed thoroughly; a sub-sample was sent to A&L Western Laboratories, Modesto, California for analysis. Soil S content has decreased (with great year-to-year variability) to an average of 14 ppm, which is in the medium range. Gypsum (16% S) is applied each spring at 250 lb/acre to add S and calcium. When Carl Rosato adds other fertilizers, he adds them in the sulfate form to increase soil S.
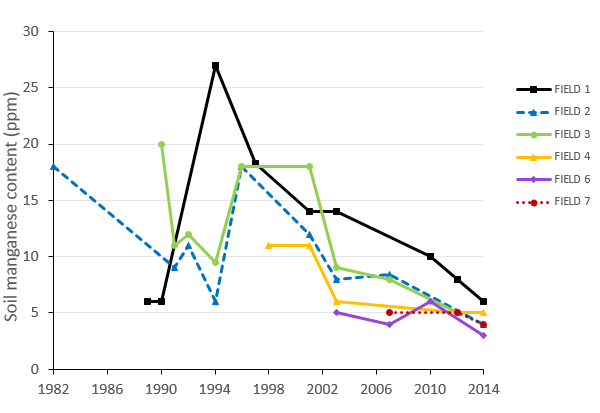
Figure 9. Soil manganese trends, 1982–2014. Samples were taken from six fields. For each field, at least 10 soil samples (0-12 inch depth) were taken with a 1” soil probe and mixed thoroughly; a sub-sample was sent to A&L Western Laboratories, Modesto, California for analysis. Soil Mn content has decreased to an average of 4.5 ppm, which is in the sufficient range. Manganese sulfate 31% was applied in spring 2015.
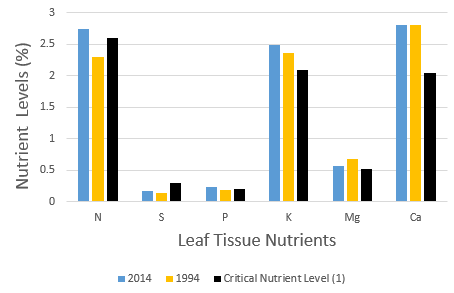
Figure 10. Peach leaf nutrient content, 1994 and 2014. O'Henry samples were taken in June from 10 random trees in the same field (Field 2) both in 1994 and 2014. Percent leaf tissue nitrogen, sulfur, phosphorus, potassium, magnesium, and calcium are reported for the two years and compared to the average “critical nutrient levels” for peach leaf tissue reported by A&L Western Labaratories.
(1) A&L Western Laboratories, Modesto, California.
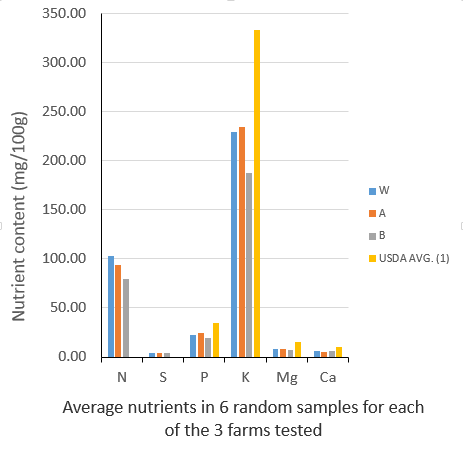
Figure 11. Peach macronutrient content, 2014. Fruit content (mg/100g) of nitrogen, sulfur, phosphorus, potassium, magnesium, and calcium were analyzed in six random O'Henry peach samples from Woodleaf Farm (W) and from two other long-term organic peach farms in northern California (Farms A and B). Woodleaf samples were taken from field 2. Macronutrient levels from all three farms were compared to USDA averages. Despite Woodleaf's low-nitrogen soil fertility system, N levels in this small sample were higher than those in the fruit from two other farms.
(1) USDA Agricultural Research Service National Nutrient Database for Standard Reference Release 28, Basic Report: 09236, Peaches, yellow, raw http://ndb.nal.usda.gov/ndb/foods.
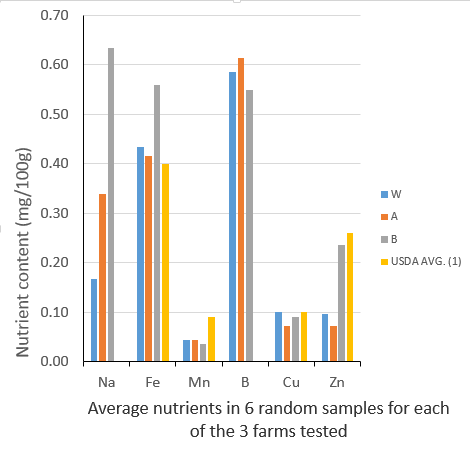
Figure 12. Peach fruit micronutrient content, 2014. Fruit contents of sodium, iron, manganese, boron, copper, and zinc were analyzed in six random O'Henry peach samples from Woodleaf Farm (W) and from two other long-term organic peach farms in northern California (Farms A and B). Woodleaf samples were taken from field 2. Micronutrient levels from all three farms were compared to USDA averages.
(1) USDA Agricultural Research Service National Nutrient Database for Standard Reference Release 28, Basic Report: 09236, Peaches, yellow, raw http://ndb.nal.usda.gov/ndb/foods.
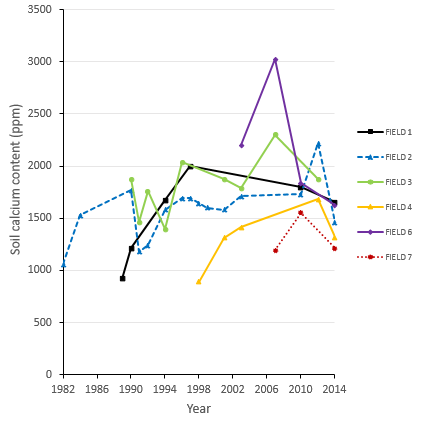
Figure 13. Soil calcium trends, 1982–2014. Samples were taken from six fields. For each field, at least 10 soil samples (0-12 inch depth) were taken with a 1” soil probe and mixed thoroughly; a sub-sample was sent to A&L Western Laboratories, Modesto, California for analysis. Soil Ca content has increased and now averages 1,524 ppm. Gypsum (22% Ca) is applied each spring at 250 lb/acre in order to achieve and maintain Woodleaf's target percent Ca levels of 68 to 70% (Fig. 14). Although limestone was previously used, none has been applied in the past 5 years.
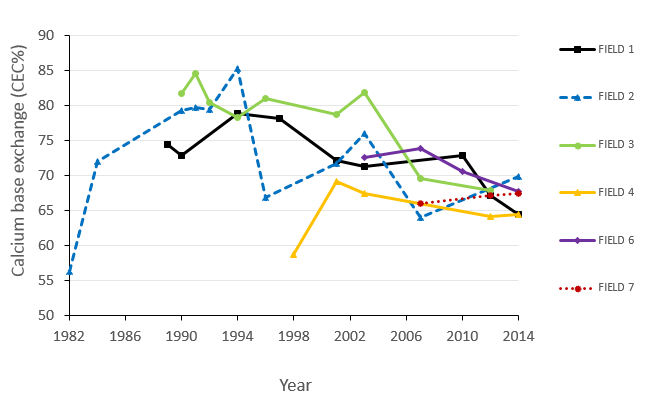
Figure 14. Soil cation balance: Calcium trends, 1982–2014. Samples were taken from six fields. For each field, at least 10 soil samples (0-12 inch depth) were taken with a 1” soil probe and mixed thoroughly; a sub-sample was sent to A&L Western Laboratories, Modesto, California for analysis. Gypsum (22% Ca) is applied annually to achieve and maintain Woodleaf's target percent Ca content of 68 to 70%. Although limestone was previously used, none has been applied in the past 5 years.
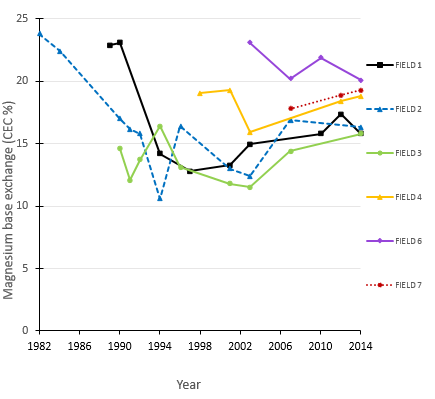
Figure 15. Soil cation balance: Magnesium trends, 1982–2014. Samples were taken from six fields. For each field, at least 10 soil samples (0-12 inch depth) were taken with a 1” soil probe and mixed thoroughly; a sub-sample was sent to A&L Western Laboratories, Modesto, California for analysis. Carl Rosato has been working to lower Mg content in order to achieve his percent magnesium target of 15%.
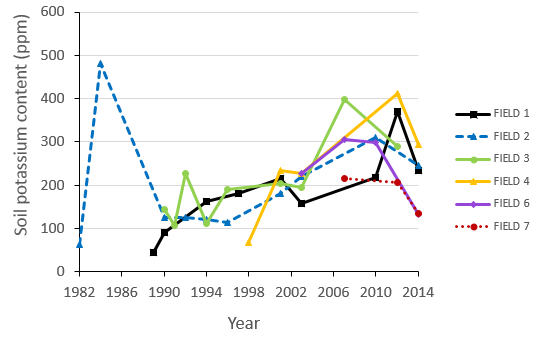
Figure 16. Soil potassium trends, 1982–2014. Samples were taken from six fields. For each field, at least 10 soil samples (0-12 inch depth) were taken with a 1” soil probe and mixed thoroughly; a sub-sample was sent to A&L Western Laboratories, Modesto, California for analysis. Soil K content has increased to an average of 173 ppm. Sulfate of potash with 50% K has been applied in the past, but not since 1990. High K levels recorded in the early years may be due to application of composted manure through 1991.
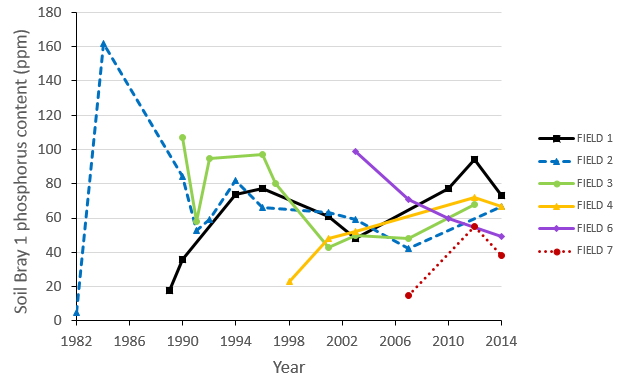
Figure 17. Soil phosphorus trends, 1982–2014. Samples were taken from six fields. For each field, at least 10 soil samples (0-12 inch depth) were taken with a 1” soil probe and mixed thoroughly; a sub-sample was sent to A&L Western Laboratories, Modesto, California for analysis. Phosphorus content was measured using the P1 (Weak Bray) method. Soil P levels increased rapidly in the 1980s and 1990s. Since then they have stabilized at an average of 95 ppm, a level that is considered high, but not excessive. High P levels recorded in the early years may be due to composted manure, which was applied through 1991. Since 1992, Woodleaf has applied a range of plant-based organic materials with varying P content throughout the year.
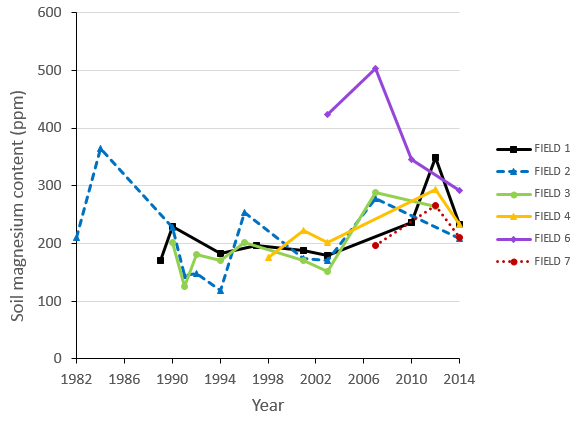
Figure 18. Soil magnesium trends, 1982–2014. Samples were taken from six fields. For each field, at least 10 soil samples (0-12 inch depth) were taken with a 1” soil probe and mixed thoroughly; a sub-sample was sent to A&L Western Laboratories, Modesto, California for analysis. Soil Mg content has increased and now averages 240 ppm, which is in the high range. Carl has been working to lower Mg levels in order to achieve his percent Mg target of 15% (Fig. 15).
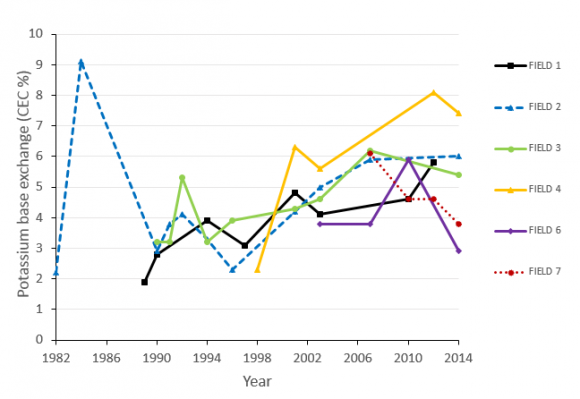
Figure 19. Soil cation balance: Potassium trends. Samples were taken from six fields. For each field, at least 10 soil samples (0-12 inch depth) were taken with a 1” soil probe and mixed thoroughly; a sub-sample was sent to A&L Western Laboratories, Modesto, California for analysis. Percent K content increased from an average of 3% to 5% and are within Woodleaf's target of 4 to 7%.
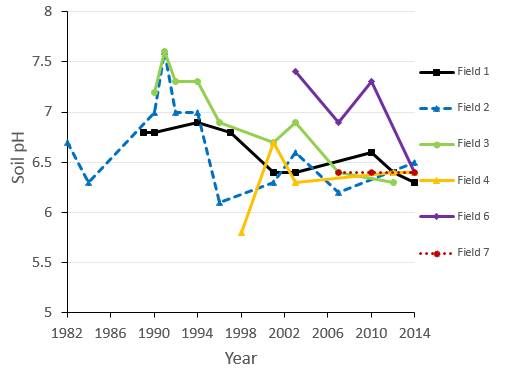
Figure 20. Soil pH trends. Samples were taken from six fields. For each field, at least 10 soil samples (0-12 inch depth) were taken with a 1” soil probe and mixed thoroughly; a sub-sample was sent to A&L Western Laboratories, Modesto, California for analysis. Soil pH decreased slightly from an average of 6.7 in the early 1980s/1990s to 6.4 in 2014 and are within Woodleaf's target of 6.3–6.8.
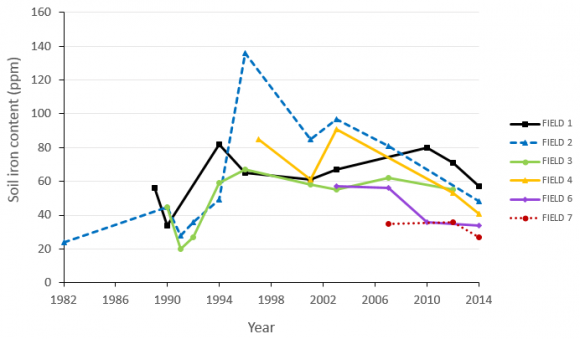
Figure 21. Soil iron trends, 1982–2014. Samples were taken from six fields. For each field, at least 10 soil samples (0-12 inch depth) were taken with a 1” soil probe and mixed thoroughly; a sub-sample was sent to A&L Western Laboratories, Modesto, California for analysis. Soil Fe content has decreased to an average of 44 ppm, which is in the sufficient range. Carl includes foliar ferrous sulfate in his mineral mix spray to supply Fe and adjust soil pH.
These figures are part of the Woodleaf Farm Organic Systems Description
Table of Contents: